Market trends in container storage
Mr. Akira Sugawara
Yano Research Institute Ltd.
This is an English translation of the original Japanese article.
Number of container storage spaces per household
The nationwide number of storage spaces in container storage facilities per household is 0.0037 (calculated based on the total number of households at the end of March 2012). This means there is about one room for every 270 households. Taking only the Greater Tokyo Area, however, where these facilities are concentrated, the number is 0.0079 rooms per household, or about one room for every 125 households. And taking each prefecture in the Greater Tokyo Area individually, the numbers of rooms per household is 0.0060 in Tokyo, 0.0124 in Saitama, 0.0083 in Kanagawa, and 0.0067 in Chiba, with about one room for every household in Saitama. Unlike indoor rental storage facilities, which as we reported last time are concentrated in urban areas, container storage facilities are being developed in more suburban areas. In particular, a relatively high number can be seen along arterial roads.
How many container storage facilities are there nationwide?
So, where are these container storage facilities, and roughly how many are there?
According to our survey carried out in July 2013, there are 5,161 locations nationwide. Figure 1 shows the companies operating in the same 5,000-location (store) class in Japan, although none had a unique brand so they have been given the generic name of some sort of business group or facility.
As expected, there are only a limited number of service networks with more than 5,000 locations nationwide. The big three convenience store chains and the top gas station chain ENEOS all have more than 10,000 stores, but McDonalds and gas station chains other than ENEOS have around 3,000 stores.
From these numbers alone, more people should be aware of container storage facilities than McDonalds or gas stations, but the name recognition and number of users of container storage services still lag behind.
[Figure 1 Major stores with around 5,000 locations nationwide]
- Circle K Sunkus 6,251 stores (as of Mar 2014)
(Japan DIY Industry Association)
- Toyota Group affiliated distributors 5,151 stores (as of Mar 2014)
(Total number of Toyota dealers, Corolla dealers, Netz dealers, Toyopet dealers)
(849 Uniqlo stores (domestic), 250 GU stores, 435 Theory stores, and others)
- High schools nationwide 4,981 schools (as of May 2013)
(MEXT’s School Basic Survey)
(Irakuya “Shirokiya,” Nomikuidokoro “Uotami,” Irakuya “Wara Wara,” and others)
- Public baths nationwide 4,804 locations (as of Mar 2013)
(Public and private bath totals: Ministry of Health, Labour & Welfare)
- Home improvement stores nationwide 4,540 stores (as of Mar 2013)
(Japan DIY Industry Association)
(Summary of organizations’ published figures by Yano Research Institute)
Container storage facilities, as mentioned at the beginning, are relatively common along arterial roads in suburban areas. (Conversely, there are only four locations within the Yamanote Line (See No.5, Market trends in rental storage, Figure 3). Therefore, as Figure 2 shows, there are many in the area of Saitama, Tokyo (in suburbs outside Circular Route 7) and Kanagawa. They are particular concentrated in Tokyo, Chiba, Saitama and Kanagawa, accounting for 58.3% of the total. The total of the top ten prefectures also accounts for 84.7% of the total nationwide.
The recent trend is for an increase in locations in regional cities too. At the time of last year’s survey (and even at the end of April 2014), there were no container storage facilities in Wakayama Prefecture or Akita Prefecture, but all other prefectures have seen a gradual increase. (Temporary storage services provided by transport companies such as moving companies are not counted as indoor rental storage or container storage locations.)
[Figure 2 Number of container storage facilities by prefecture]
| Prefecture |
No. of locations |
Share |
| Saitama |
941 |
18.2% |
| Tokyo |
889 |
17.4% |
| Kanagawa |
785 |
15.2% |
| Aichi |
500 |
9.7% |
| Chiba |
382 |
7.4% |
| Osaka |
242 |
4.7% |
| Fukuoka |
194 |
3.8% |
| Hyogo |
193 |
3.7% |
| Hiroshima |
134 |
2.6% |
| Shizuoka |
97 |
1.9% |
| Toral |
5,157 |
100% |
(From research by Yano Research Institute)
Characteristic area trends in container storage
Within Saitama Prefecture, which has the highest number of container storage locations as seen in Figure 2, we can narrow down the trading area further to show where container storage is most concentrated. Figure 3 shows the area around Toda Station and Kita-Toda Station in Toda-shi, Saitama. There are containers with a total of almost 1,000 rooms. Calculated based on the number of households inside the blue circle, there are 0.065 rooms per household or about one room per 15 households. To give a better sense of what this means, there is about one room of container storage per low-rise medium-size apartment block.
[Figure 3 Distribution of indoor rental storage and container storage around Toda-shi, Saitama]
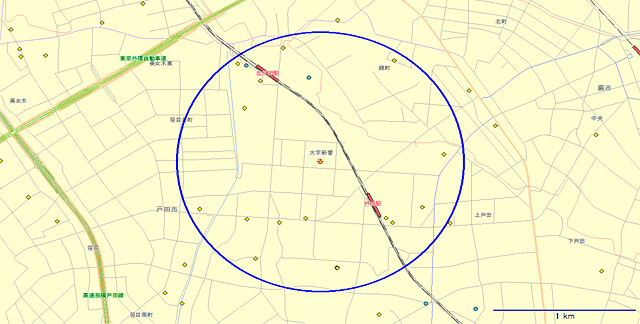
(●: rental storage ◆: container storage)
Figure 4 shows the area around the Tobu Tojo Line’s Asaka Station and Asakadai Station (JR Kita-Asaka Station). With 27 container locations in a one-kilometer radius, it has the highest concentration of container storage facilities in Japan. Calculated based on the number of households inside the blue circle, there are 0.071 rooms per household or about one room per 14 households.
[Figure 4 Distribution of indoor rental storage and container storage around Asaka-shi, Saitama]
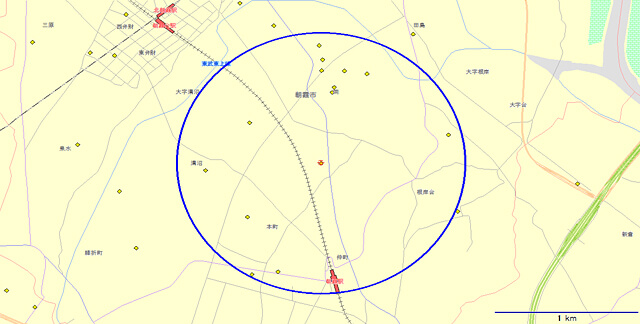
(●: rental storage ◆: container storage)
Figure 5 shows the area around Hira Station and Otai Station on the TKJ Johoku Line in Nishi-ku, Nagoya-shi, Aichi Prefecture. There are 19 container storage facilities in a one-kilometer radius. Calculated based on the number of households inside the blue circle, there are 0.080 rooms per household or about one room per 12.5 households.
[Figure 5 Distribution of indoor rental storage and container storage around Nishi-ku, Nagoya-shi, Aichi]
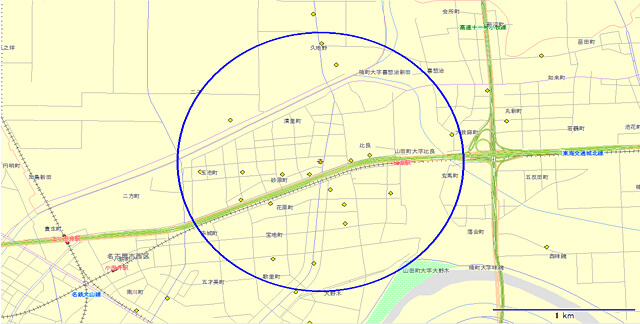
(●: rental storage ◆: container storage)
Major players in container storage
So what kind of companies are the players (service providers) in container storage?
[Players and numbers of locations]
According to our research, 380 companies are running container storage facilities nationwide (including companies and one-man businesses operating as franchises.) A feature of container storage is that although single-location operators make up the largest component, they are still only 43.8% of the total (Figure 6). Instead, medium size operators (which have developed 11 or more locations) make up 20.1% of the total. Depending on the area, there are also many cases of capturing a share with a local-only brand.
[Figure 6 Player composition ratio by number of developed locations]
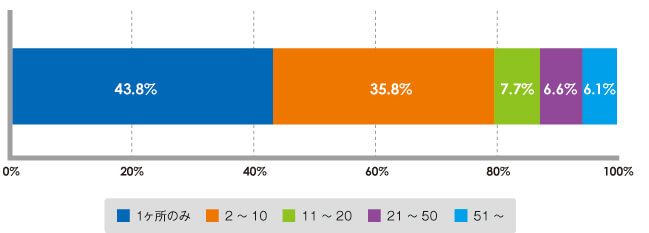
(From research by Yano Research Institute)
Analysis of operators ranked according to the most locations shows that the top three companies have a combined share of 25.9% of all locations. Looking at the number of locations of the top ten companies, their combined share accounts for 47.5% (Figure 7).
Ranking container storage operators according to which has the most locations, first is Arealink, followed by Kase Soko, Utilize, Uniful, and Land Pia.
In a recent trend, major nationwide operators are expanding into regional cities and away from the three congested major metropolitan areas.
[Figure 7 Composition ratio of top players in number of locations]
Combined share of locations of top three companies
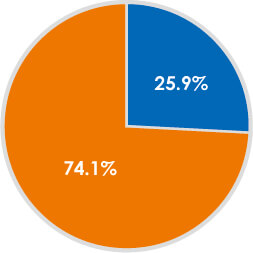 Blue: Top Three Companies / Orange: Other
Combined share of locations of top ten companies
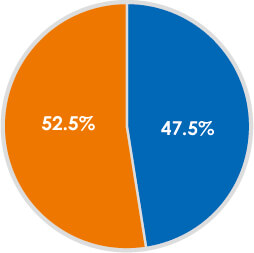 Blue: Top Ten Companies / Orange: Other
(From research by Yano Research Institute)
[Players and numbers of rooms]
The number of rooms (or number of units) means the number of individual storage spaces that are created by dividing up one container and then let under individual contracts. We surveyed or estimated the number of containers and number of rooms in each location, and estimated that the total number of units nationwide is in excess of 200,000.
As with the number of locations, an analysis of operators ranked according to the most rooms shows that the top three companies have a combined share of 33.6% of all rooms. The top ten companies have a combined share that accounts for more than half at 57.6% (Figure 8).
[Figure 8 Composition ratio of top players in number of rooms]
Combined share of rooms of top three companies
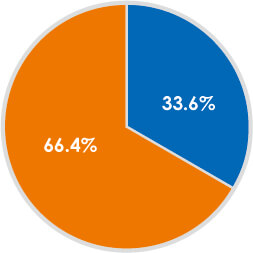 Blue: Top Three Companies / Orange: Other
Combined share of locations of top ten companies
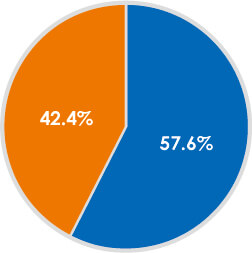 Blue: Top Ten Companies / Orange: Other
(From research by Yano Research Institute)
Ranking container storage companies by number of rooms, Arealink is top, followed by Kase Soko, Utilize, YourSpace, and Sankyo Frontier.
The top two companies own more than 20,000 rooms each and the third and fourth placed companies more than 10,000 rooms. There are 37 operators with more than 1,000 rooms, many of which are characterized by their dominant style of store expansion focusing on a rather limited region.
[Categories of players]
Broadly categorizing the major players in container storage, the vast majority are operators that have been handling the sale of containers or operators in local property (in many cases, handling the mediation or management of rented accommodation in their area.)
Although not exactly cross-industry, leading storeroom manufacturer Inaba Seisakusho has entered the business of renting out its own storage spaces. Portable building maker Sankyo Frontier has also built up its own storage business, developing containers for storage using its own portable building technology. Their merit is that they do not simply manufacture “boxes” for outdoor storage like containers, but they also have the special creativity to include shelves, racks and so on for storage.
Other players are operators who have developed franchises by suggesting the container business to landowners as a means of utilizing their land more effectively. (There are cases of the same method being applied in the indoor rental storage business too.)
About the Yano Research Institute
The Institute conducts comprehensive research and analysis on appropriate themes from a micro and macro perspective to determine trends in market size, business share, future prospects, trends among major players, and the like in a broad range of business fields.
We focused early on the storage business field, which continues to grow, and we have provided detailed investigative reports based on thorough reporting since 2010.
We are making a significant contribution to improving transparency in the storage business industry, by analyzing the future prospects, potential, and issues in a market that had scarce information.