Major players in indoor rental storage
So what kind of companies are the players (service providers) in indoor rental storage?
[Players and numbers of locations]
According to our research, 450 companies are running indoor rental storage facilities nationwide (including companies and one-man businesses operating as franchises.) A feature of indoor rental storage is that most operators, 66.4% of the total, provide services at only one location (Figure 6). From an analysis of the business attributes of operators, we can guess that in many cases owners of one building utilize their empty floors (or empty space) to start a rental storage business.
[Figure 6 Player composition ratio by number of developed locations]
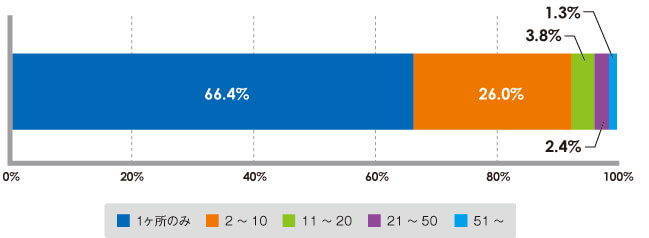
(From research by Yano Research Institute)
Analysis of operators ranked according to the most locations shows that the top three companies have a combined share of 36.3% of all locations. Looking at the number of locations of the top ten companies, their combined share accounts for more than half at 51.6% (Figure 7).
The recent trend is for many new operators to enter the market while the leading players also steadily increase their number of locations, which is why the market composition ratio is not showing much change. Medium-size operators (with two to ten locations) have not increased their number of locations much.
[Figure 7 Composition ratio of top players in number of locations]
Combined share of locations of top three companies
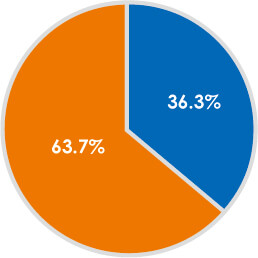 Blue: Top Three Companies / Orange: Other
Combined share of locations of top ten companies
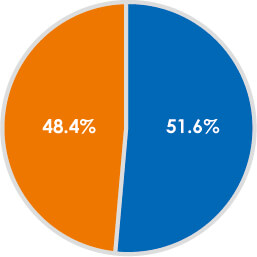 Blue: Top Ten Companies / Orange: Other
(From research by Yano Research Institute)
Ranking indoor rental storage operators according to which has the most locations, first is Reise (including Tokyo Reise), followed by Arealink then Kase Soko, City Housing, and NPS Tokyodoh. Arealink and Kase Soko have aimed to develop nationwide but the only places where they have launched rental storage facilities have been urban areas. Reise have only grown in Greater Tokyo and the Kansai area, City Housing have concentrated on Ota-ku and Shinagawa-ku in Tokyo, and NPS Tokyodoh have expanded from Tokyo Metropolis to the Tama area and parts of Saitama.
[Players and number of rooms]
The number of rooms (or number of units) means the number of individual storage spaces that are created by dividing up one location and then let under individual contracts. We surveyed the number of rooms in each location (facility, building, floor, etc.) and estimated that the total number of units nationwide is in excess of 150,000.
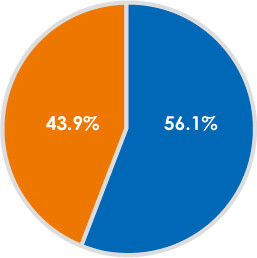
As with the number of locations, an analysis of operators ranked according to the most rooms shows that the top three companies have a combined share of 41.0% of all rooms. The top ten companies have a combined share that accounts for more than half at 56.1% (Figure 8).
[Figure 8 Composition ratio of top players in number of rooms]
Combined share of rooms of top three companies
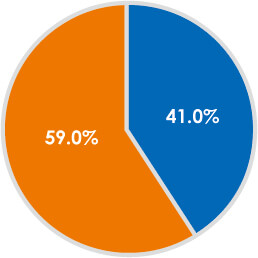 Blue: Top Three Companies / Orange: Other
Combined share of locations of top ten companies
 Blue: Top Ten Companies / Orange: Other
(From research by Yano Research Institute)
Ranking indoor rental storage companies by number of rooms, Quraz is the leader with its focus on large-scale stores. Next is Reise, followed by Arealink, Kase Soko, and Keiyo Distribution Warehouse.
The share of these top three companies is higher than that of the top three in terms of number of locations. At the time of our survey, the top three companies owned more than 10,000 rooms, but there is some fall in the number of rooms in the companies below them, from fifth position down.
[Categories of players]
We have broadly categorized the main players in indoor rental storage. There are some differences in the content of the rental storage services of each company. Apart from location and cost, if we compare the operators’ reliability, security, and services such as air-conditioning, there are many unexpected differences, and users may be able to look for some services that match their own utilization purposes.
1. Railway groups:
Railway group operators have developed services mainly for the effective utilization of space underneath elevated railway tracks. The Tokyu Group has started to develop stores in areas near its stations other than underneath railway tracks.
Major operators: Odakyu, Sotetsu, Keihan, Keisei, Tokyu, Metro Kaihatsu, Tobu, Keio, Japan Railways, etc.
2. Storage/logistics:
There are cases of storage and logistics companies entering the rental storage business as an extension of their warehousing business trunk room operations, and of others entering as estate agent operators to effectively utilize their empty warehouses.
Major operators: Terrada Warehouse, Oshiire, Keiyo Distribution Warehouse, Naka Nihon Van Lease, Storage Service, Miyako Transport, etc.
3. Construction:
During storage space construction projects, construction companies also run rental storage services. They make proposals to land owners on how to effectively utilize their land.
Major operators: Reise, Storage-Oh, etc.
4. Materials:
Many common items with construction and container business. Operators have developed their storage business utilizing temporary materials, second-hand containers, etc. This can also be seen as one kind of proposal for the effective utilization of property.
Major operators: Sankyo Frontier, Daiwa Lease, Kase Soko, Inaba Seisakusho, etc.
5. Property development:
Companies own land and buildings themselves with which they develop their storage business. They also have a service operator side in order to develop their storage services full-time.
Major operators: Quraz, Trust One, Storage Plus, Arealink, etc.
6. Property management/mediation:
Property management is often done by especially regional property operators. They develop rental storage as one form of property management. Being based in local areas, they are characterized by their dominant style of store expansion.
Major operators: Kase Soko, Arealink, Orient Home, NPS Tokyodoh, Hirota, Yoshizumi Home, etc.
7. Franchises:
Provide knowhow on storage service business models and expand franchises among land owners, etc.
Major operators: YourSpace, Land Pia, Oshiire, Ambitious, etc.
8. Cross-industry:
All operators have aspects of being cross-industry, but many enter the rental storage business having been operators handling warehousing, property, and container business.
Major operators: Aichi Sharyo Kogyo, Akatsuki Financial Group, etc.