Housing and the storage business
Mr. Akira Sugawara
Yano Research Institute Ltd.
This is an English translation of the original Japanese article.
This is a series of ten reports on the storage business and self-storage markets in Japan, from a market environment perspective.
Japan’s housing situation
apanese homes are generally said to be smaller than homes in the West. Comparing statistics on home sizes from various countries shows that American homes are overwhelmingly the largest, but that Japanese and European homes are not so different in size that we should feel inferior. (Depending on the statistics of different countries, however, there are differences in the way average floor areas are calculated, and in the figures compared such as averages for new buildings only or averages for housing stock.)
[Average floor area per home in new housing of various countries]
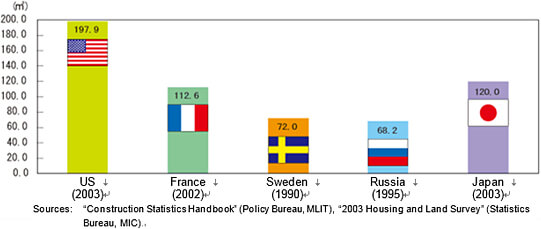
(From the Statistics Bureau, MIC website)
The trends in average floor area of new homes in Japan are shown in the following graph. Predictably, to some extent, custom-built houses are the largest followed by houses built for sale, apartments built for sale, and rented homes, with custom-built houses being more than twice the size of rented homes. Looking at the trends in size over time, we can see that they have remained almost the same. Comparisons with slightly older data show that the floor area per home has increased, but in recent years there is no trend toward bigger homes. Factors behind this include a fall in the number of household members per dwelling unit (due to the growth of the nuclear family, declining birthrate, etc.) and an increase in urban mini-developments where one large lot is subdivided into smaller lots on which multiple new homes are built and sold.
Because there is already a lot of housing stock (existing homes) and an increase in choice of homes, whether to buy or rent, the trend toward size in new homes is likely to remain constant in future. (The latest trend is toward downsizing due to the increase in consumption tax and sharp rise in building costs.)
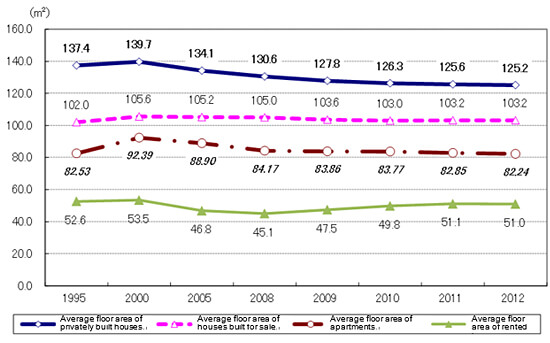
(Created by Yano Research Institute from statistics on building construction starts)
- Average floor area of privately built houses (commonly called custom-built houses) Close to 140 m2 in 1995 and 2000, but then dropped below 130 ㎡
- Average floor area of houses built for sale (commonly called ready-built houses) Looking at the past 15 years, remained almost unchanged between 102 and 106 ㎡
- Average floor area of apartments built for sale (excluding those built mainly for renting out)
*Average floor area including communal areas, not average exclusive floor area per dwelling unit
Exceeded 90 m2 in 2000 but later dropped to the 80 m2 or more range
- Average floor area of rented homes (commonly called rented apartments)
*Average floor area including communal areas, not average exclusive floor area per dwelling unit
Nearly always around the 50 m2 mark
Trends in average floor area by prefecture
Needless to say, we can easily assume that average floor areas are smaller in urban areas and larger in suburbs and the countryside. The top five prefectures in terms of average floor area per custom-built house are in the Tohoku region (on the Japan Sea side) and Hokuriku region. The bottom five include Tokyo, Kanagawa and Kyoto, as anyone would imagine, but surprisingly there is also a trend for building compact houses in the southern Kyushu prefectures of Kagoshima and Miyazaki.
It is difficult to find any connection between the top five prefectures in terms of average floor area per rented home, namely, Okinawa, Nagano, Nara, Oita and Hokkaido, but the bottom five, Tokyo, Kanagawa, Kyoto, Saitama and Osaka, are all densely populated urban areas.
[Average floor area of new custom-built houses in 2012]
Top 10
| Prefecture |
Custom houses |
| Fukui |
143.20 |
| Toyama |
142.03 |
| Yamagata |
140.95 |
| Niigata |
133.11 |
| Akita |
133.07 |
| Miyagi |
132.81 |
| Aomori |
132.52 |
| Ishikawa |
132.25 |
| Hokkaido |
130.70 |
| Saga |
130.63 |
Bottom 10
| Prefecture |
Custom houses |
| Saitama |
120.73 |
| Chiba |
120.63 |
| Yamaguchi |
119.91 |
| Okinawa |
119.35 |
| Kochi |
118.45 |
| Miyazaki |
118.39 |
| Tokyo |
118.02 |
| Kyoto |
116.93 |
| Kanagawa |
116.60 |
| Kagoshima |
114.41 |
[Average floor area of rented homes in 2012 ]
Top 10
| Prefecture |
Rented |
| Okinawa |
60.17 |
| Nagano |
58.69 |
| Nara |
58.00 |
| Oita |
57.59 |
| Hokkaido |
57.52 |
| Nagasaki |
57.29 |
| Mie |
57.06 |
| Aichi |
57.03 |
| Tottori |
56.94 |
| Tokushima |
56.51 |
Bottom 10
| Prefecture |
Rented |
| Hyogo |
51.17 |
| Yamaguchi |
50.28 |
| Kagoshima |
50.00 |
| Niigata |
49.44 |
| Chiba |
48.92 |
| Osaka |
48.30 |
| Saitama |
47.88 |
| Kyoto |
46.10 |
| Kanagawa |
46.08 |
| Tokyo |
44.44 |
Floor area trends and storage services (rental storage, container storage, trunk rooms)
Comparing trends in home size and in the number of storage service rooms (number of rental spaces) as counted by Yano Research Institute, half of the top ten prefectures in terms of “average floor area of new custom-built houses in 2012” were in the bottom ten prefectures in terms of available storage services. Conversely, half of the bottom ten in “average floor area of new custom-built houses in 2012” were in the top ten in available storage services. Of the top ten prefectures with the most storage services, seven ranked in the bottom ten in “average floor area of rented homes in 2012,” but of the bottom ten prefectures in available storable storage services, only one ranked in the top ten in “average floor area of rented homes in 2012.”
By seeking out the need for storage services from the perspective of home size in this way, we can read a hypothesis that storage services are required in areas where residential floor space is smaller or rented homes are more numerous, that is, areas where there are many older rented homes.
We have tried using general macro-style data, but what about looking at the “face” of a town or community, not only the size of its population, in thinking about storage services?
[Number of storage service rooms (rental storage, container storage, trunk rooms) by prefecture]
Top 10
| Prefecture |
No. of storage spaces |
| Tokyo |
104,462 |
| Kanagawa |
54,259 |
| Saitama |
43,141 |
| Osaka |
33,571 |
| Chiba |
21,118 |
| Aichi |
20,506 |
| Hyogo |
15,854 |
| Fukuoka |
10,017 |
| Shizuoka |
6,178 |
| Kyoto |
5,393 |
Bottom 10
| Prefecture |
No. of storage spaces |
| Toyama |
309 |
| Iwate |
256 |
| Kochi |
240 |
| Yamagata |
203 |
| Yamanashi |
144 |
| Saga |
127 |
| Yamaguchi |
117 |
| Fukui |
71 |
| Tottori |
66 |
| Akita |
40 |
About the Yano Research Institute
The Institute conducts comprehensive research and analysis on appropriate themes from a micro and macro perspective to determine trends in market size, business share, future prospects, trends among major players, and the like in a broad range of business fields.
We focused early on the storage business field, which continues to grow, and we have provided detailed investigative reports based on thorough reporting since 2010.
We are making a significant contribution to improving transparency in the storage business industry, by analyzing the future prospects, potential, and issues in a market that had scarce information.